
Conversion Rate Optimization (CRO) Benchmarks for 2026




Conversion Rate Optimization (CRO) improves a website so that more visitors take action, such as buying or signing up. It focuses on getting better results from existing traffic by reducing friction and making the experience easier.
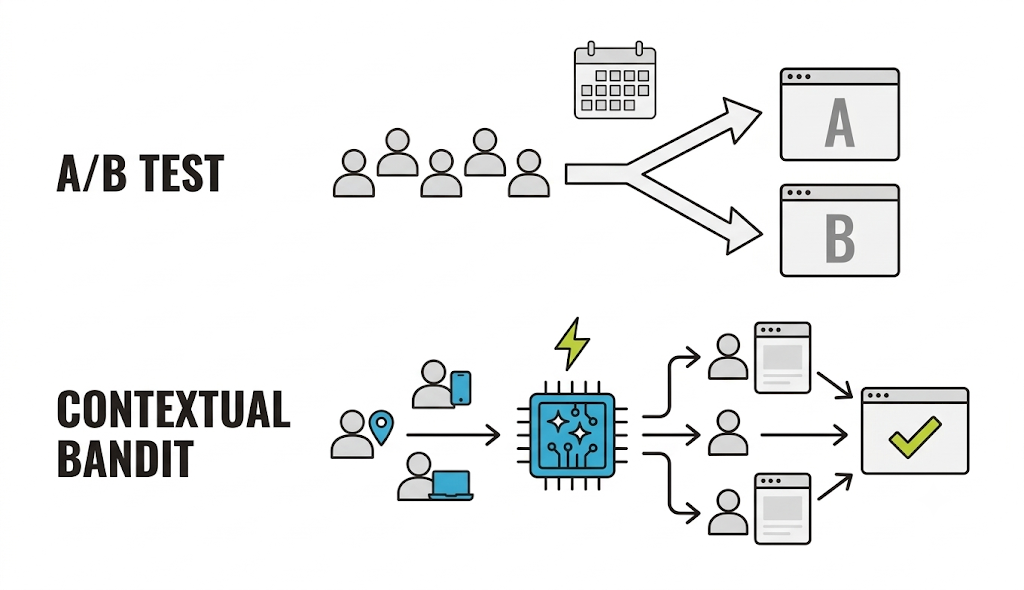
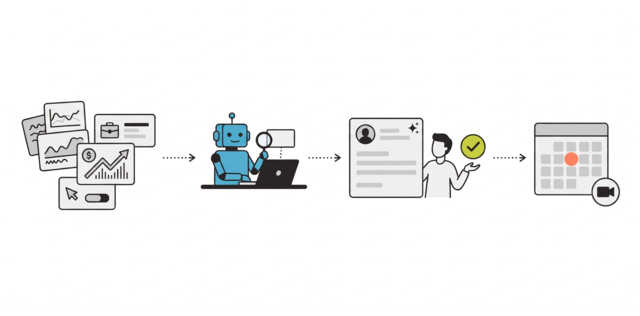
In 2026, CRO uses conversion intelligence, an AI system that analyzes real-time user behavior to understand intent and adjust the website in real time. It replaces slow A/B testing with automated decisions that show each visitor the most relevant experience.
CRO aims to increase conversions. Conversion Intelligence helps reach that goal faster by predicting user needs and adapting in real time.
Key Takeaways
- Conversion rate optimization improves results from existing traffic instead of adding more visitors.
- In 2026, CRO uses AI systems to personalize user experiences in real time
- High traffic does not always lead to sales due to intent mismatch, friction, and lack of trust
- Conversion rates vary by industry, device, and traffic source
- Mobile drives most traffic, but desktop users convert at higher rates
- Website speed and performance directly affect conversions
- Businesses improve conversions by reducing friction, simplifying checkout, and personalizing experiences
How does Conversion Rate Optimization work in 2026?
Conversion Rate Optimization in 2026 uses AI to improve websites in real time. Systems adjust content, layout, and messaging based on user behavior.
This method is called Conversion Intelligence. It:
- Tracks user behavior such as clicks, scrolling, and device type
- Predicts what users want
- Updates the website instantly
AI systems also improve accuracy at scale, reducing testing errors by up to 60%, according to UIPath 2026 AI and Agentic Automation Trends Report. This removes the need for long testing cycles. With conversion intelligence, businesses can improve performance while testing.
How to Calculate Your Conversion Rate
Conversion rate measures how many visitors complete an action.
The formula is:
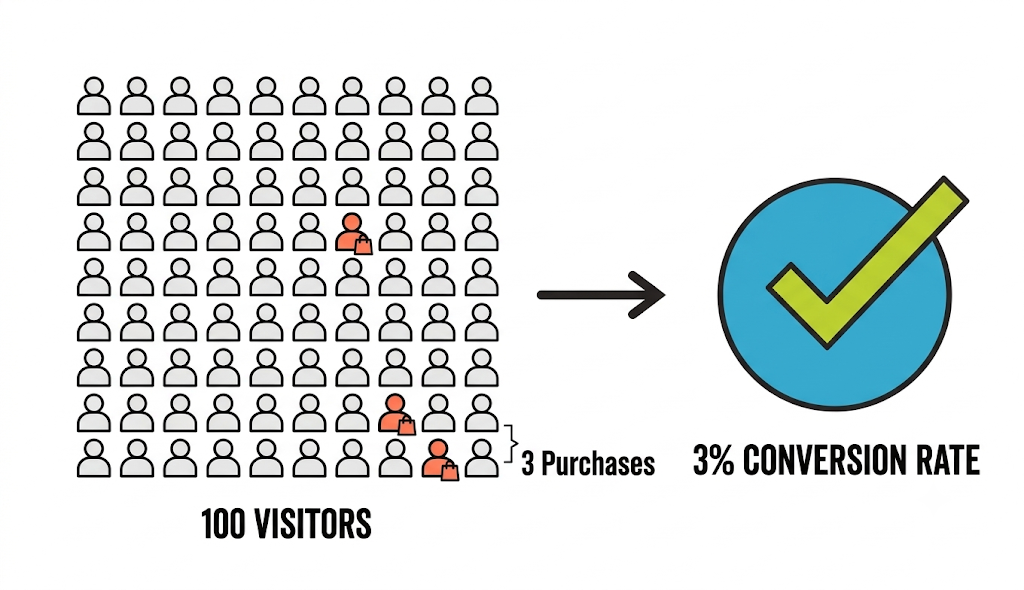
Conversion rate =(Conversions / Total Visitors) × 100
If 100 people visit your website and 3 make a purchase, your conversion rate is 3 percent.
This metric helps you track performance and compare your results with industry benchmarks.
5 Common Reasons Why High Website Traffic Does Not Convert into Sales
High website traffic does not guarantee sales because many visitors are not ready to buy or encounter barriers during their experience. This gap, known as the traffic paradox, happens when user intent, website performance, or trust signals are misaligned.
1. Intent Mismatch
An intent mismatch occurs when visitors arrive on a page that does not match their search, leading to confusion and immediate drop-off rather than conversion.
Many users come from search queries with specific intent. If the landing page does not clearly reflect that intent, users leave within seconds.
- Case Study: Campaign Monitor
Visitors arrived from specific Google searches, but landing pages did not match their intent, creating a gap between expectations and content.
To fix this, ConversionLab implemented dynamic text replacement, which automatically updated landing page headlines to match the exact search terms used.
By aligning messaging with user intent, Campaign Monitor increased free trial sign-ups by 31.4%.
2. Technical Friction
Technical friction occurs when users face usability issues such as slow load times, complex navigation, or broken flows that prevent them from completing actions.
Even small usability issues can disrupt the user journey and cause users to leave.
- Case Study: Regional Food Delivery App
The app’s multi-step ordering process made it difficult for users to navigate and complete purchases, especially during peak hours.
The company redesigned the experience with a simplified, visually guided interface that reduced steps and improved usability.
By removing technical barriers, the app reduced drop-offs and increased completed orders, particularly during high-traffic periods.
3. Checkout Friction
Checkout friction happens when the buying process is too long, complicated, or includes unexpected steps, causing users to abandon their purchase before completion.
A complex checkout creates hesitation at the final stage, where users are closest to converting.
- Case Study: Intertop
Intertop found that its cart and checkout experience included confusing elements, such as unstructured information, duplicate actions, and poor navigation.
They used a step-by-step optimization approach based on data and A/B testing to simplify the checkout flow and improve usability across desktop and mobile devices.
By removing friction and improving the checkout experience, Intertop achieved up to a 128% increase in overall checkout conversion rate, with additional gains across both mobile and desktop.
4. Trust Deficit
Trust deficit occurs when users do not feel confident enough to complete a purchase due to a lack of credibility signals, clear messaging, or proof of reliability.
Without trust, even interested users hesitate to convert.
- Case Study: Taylor Made Marketing
The company found that generic messaging failed to build credibility with potential customers.
They shifted their strategy to emphasize localized trust signals and service-specific messaging that directly addressed user concerns.
By strengthening credibility and relevance, the company improved trust and drove consistent growth in qualified leads.
5. Poor Mobile Experience
Poor mobile experience reduces conversions when websites are not designed for smaller screens, making navigation, interaction, and checkout difficult for mobile users.
Since most traffic comes from mobile devices, poor usability directly impacts conversion rates.
- Case Study: New Balance Chicago
The retailer relied on desktop-focused campaigns that did not translate well to mobile users, leading to poor engagement.
They redesigned their landing pages with a mobile-first approach, simplifying navigation, improving touch interactions, and highlighting key information.
This shift led to a 200% increase in in-store sales while reducing ad spend by 50%.
Why Conversion Benchmarks Matter Before Optimizing
Benchmarks help you understand what good performance looks like, providing context, identifying gaps, setting realistic targets, and prioritizing the most impactful improvements.
Without benchmarks, it is difficult to know whether a conversion rate is strong or underperforming.
Benchmarks also help:
- Identify areas that need improvement
- Compare performance across devices and channels
- Set realistic goals based on data
This is why understanding global conversion data is a critical first step before making optimization decisions.
Global Conversion Benchmarks and Industry Performance Standards
Conversion rates vary by industry, device, and traffic source. These benchmarks help set realistic goals and identify gaps.
In 2026, median conversion rates vary by industry: Personal Care (6.8%), Food & Beverage (4.9-6.1%), and Retail (1.9%). Key technical targets include a Largest Contentful Paint (LCP) under 1.5s and Interaction to Next Paint (INP) under 200ms. Optimization now relies on Agentic AI and Contextual Bandits rather than traditional A/B testing.
These benchmarks are based on aggregated data from large-scale e-commerce studies and interpretations of CRO data across multiple industries.
Industry Median Performance
Based on e-commerce benchmark reports from Skai Lama (2026) and Content Crashers (2026), conversion rates differ widely across industries due to pricing, purchase frequency, and decision complexity.
These differences show that industries with frequent, low-cost purchases convert at higher rates.
How to use these benchmarks:
Use these numbers as directional targets, not fixed goals. Compare your performance within your specific industry first before benchmarking against broader ecommerce averages.
Device and Regional Data
Based on global ecommerce performance data from Skai Lama (2026), conversion rates vary significantly depending on device type and geographic region.
Desktop users often convert at nearly double the rate of mobile users, largely due to better usability, larger screens, and fewer distractions during the purchase process.
How to use these benchmarks:
Evaluate your performance by device first. If your mobile conversion rate is significantly lower, focus on improving speed, navigation, and checkout experience for mobile users.
Traffic Source Performance
Based on multi-channel conversion data from Convertibles (2026) and Skai Lama (2026), conversion rates depend heavily on user intent and how visitors arrive on a website.
Owned channels like email typically perform better because users already have an established relationship with the brand. At the same time, social media traffic tends to convert lower due to lower immediate buying intent.
This aligns with broader industry patterns where high-intent channels consistently outperform discovery-based traffic sources.
How to use these benchmarks:
Compare conversion rates across channels rather than overall averages. A low conversion rate from social media may be normal, while the same rate from email could indicate a problem.
Technical Performance Standards
Based on CRO and SEO performance benchmarks from Tatvic (2026), website speed and stability metrics directly impact user experience and conversion outcomes.
Metrics like LCP and INP are part of Google Core Web Vitals, a standard introduced by Google to measure real user experience and page performance.
What these metrics mean:
- Largest Contentful Paint (LCP): Measures how fast the main content loads
- Interaction to Next Paint (INP): Measures how quickly the site responds to user actions
- Time to First Byte (TTFB): Measures how fast the server responds
- Cumulative Layout Shift (CLS): Measures visual stability during page loading
Even small speed improvements can increase revenue by reducing friction and keeping users engaged.
Privacy and Compliance in 2026
Personalization must follow strict privacy rules, including recent regulations that protect consumer data.
- GDPR updates (2026) require clear consent and transparency
- Digital Markets Act (DMA) limits how data is collected and used
This means:
- Users must understand how their data is used
- Businesses must give control over personalization
- AI systems must follow privacy laws
Future Trends in CRO for 2026 and Beyond
Conversion rate optimization is moving toward fully automated systems that predict and adjust user experiences in real time. These trends focus on reducing friction and responding to user intent faster.
1. Agentic Automation and Multi-Agent Systems
Agentic automation uses AI systems that independently manage testing, analysis, and optimization tasks to improve performance faster and reduce operational costs.
These AI tools can act autonomously to run experiments, allocate traffic, and optimize pages continuously. Meetanshi’s Generative AI Statistics in 2026 reports that these systems can reduce operational costs by up to 25%.
2. Transition to Contextual Bandits
AI systems are replacing traditional A/B testing, called contextual bandits. These are a form of machine learning that uses user context (such as location, device, and behavior) to immediately decide which variation to show.
The market for this advanced software will likely exceed $5 billion by late 2026, according to Verified Market Reports.
3. Integration of SEO and CRO
SEO (search engine optimization) refers to improving a website's ranking in search results. Both SEO and CRO now work together by identifying user behavior signals like engagement and speed to rank websites, making performance improvements critical for both traffic and conversions.
A 2020 Deloitte study indicated that a 0.1-second improvement in site speed can increase retail sales by up to 8.4%.
4. Conversational AI Drivers
Conversational AI includes chatbots and virtual assistants that assist users during their buying journey. These chat-based systems interact with users in real time, answer questions, and guide decisions, leading to higher conversion rates compared to static website experiences.
Users who use live chat are 513% more likely to buy, according to Meetanshi's 2025 Consumer Behavior Trends study.
5. Predictive CRO
Predictive optimization uses historical data from past experiments to forecast which website changes will perform best, reducing risk and improving results before updates are launched.
These systems analyze large datasets to identify patterns and predict outcomes, removing the need for trial-and-error testing.
Despite these advanced systems, many businesses still struggle to convert visitors into customers, showing that traffic alone is not enough to drive revenue.
How to Improve Conversion Rates
Improving conversion rates means making your website faster, easier to use, and more relevant to each visitor. Focus on reducing friction, aligning with user intent, and using AI-driven personalization to guide users to take action.
- Improve website speed
Ensure your website loads quickly and responds instantly. Faster performance keeps users engaged and reduces drop-offs. - Match content to user intent
Align your pages with what users are searching for. Clear messaging helps users understand they are in the right place. - Simplify checkout
Reduce the number of steps needed to complete a purchase. A shorter process makes it easier to convert. - Build trust
Show reviews, testimonials, and clear policies. Trust signals help users feel confident. - Optimize for mobile
Design your website for smaller screens with simple navigation and easy interaction. - Use AI personalization
Adjust content based on user behavior to improve relevance and engagement. - Replace forms with chat
Use conversational tools to guide users and answer questions in real time. - Focus on high intent traffic
Prioritize users from channels like email and direct traffic who are more likely to convert.
Final Thoughts
Improving conversion rates requires a focus on speed, usability, and relevance.
AI systems now make it possible to optimize in real time. Businesses that reduce friction and improve user experience will get more value from their traffic.
- Improve Website Speed
Ensure pages load in under two seconds and respond instantly to user actions. Speed directly impacts both rankings and conversions.
- Use AI Chat Instead of Static Forms
Replace traditional forms with AI chat systems that answer questions and reduce hesitation during decision-making. - Personalize User Experience
Use machine learning to adjust content based on:
- Traffic source
- User behavior
- Device type
This ensures each visitor sees the most relevant version of your site.
Frequently Asked Questions (FAQs)
What is the "traffic paradox" in digital marketing?
The traffic paradox occurs when a website receives a large number of visitors but fails to generate sales because those visitors are not ready to buy or face barriers during their experience.
This usually happens when:
- The content does not match user intent
- The website is slow or hard to navigate
- There is not enough trust or clarity to complete a purchase
To fix this, focus on improving user experience and aligning your pages with what visitors are actually looking for.
How much does website speed actually affect sales?
Website speed directly affects whether users stay on your site long enough to take action. Slow pages increase drop-offs, while faster pages improve engagement and conversions.
Even small delays can frustrate users, especially on mobile devices.
To improve speed:
- Optimize images and reduce page size
- Use faster hosting or servers
- Minimize unnecessary scripts and plugins
Faster websites reduce friction and make it easier to complete actions.
Which marketing channels have the best conversion rates?
Marketing channels convert differently depending on user intent, but channels with higher trust and intent usually perform better.
In most cases:
- Email and direct traffic convert higher because users already know the brand
- Organic search performs well when content matches user intent
- Social media often converts lower because users are still exploring
Instead of comparing all channels equally, evaluate each one based on its role in the customer journey.
Read These Next
How to Build Automated Growth Hacking Tools in 2026